In this session, we will begin to work on a lab focused on measures of residential segregation. We will also spend some time workshopping your approach to the Population Memo.
We’ll take around 20 minutes at the beginning of class for you to share with each other what you’re thinking and your approach.
We’ll then engage any questions you have about this week’s lab or last week’s lab.
Please come ready to share your approach to the population memo in small groups. Please bring in examples of analysis or visualization that we can look at, either in small groups or collectively.
Reflect
Code
In class, we spent some time looking at code that would select tracts within census place geographies. Here’s that code for your reference.
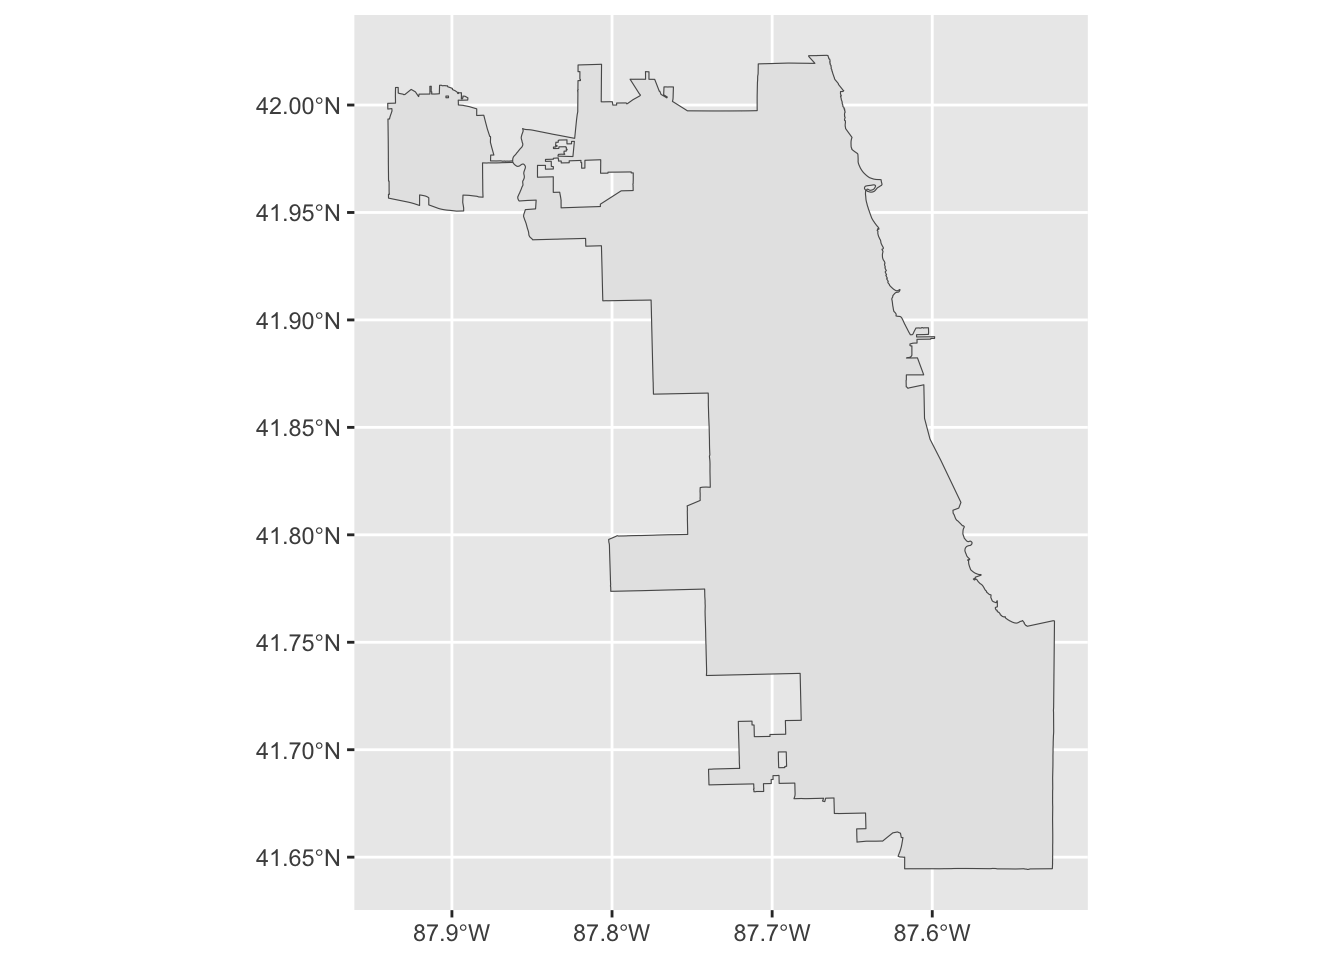
Let’s start by downloading tract and place geometries and selecting Chicago (as an example):
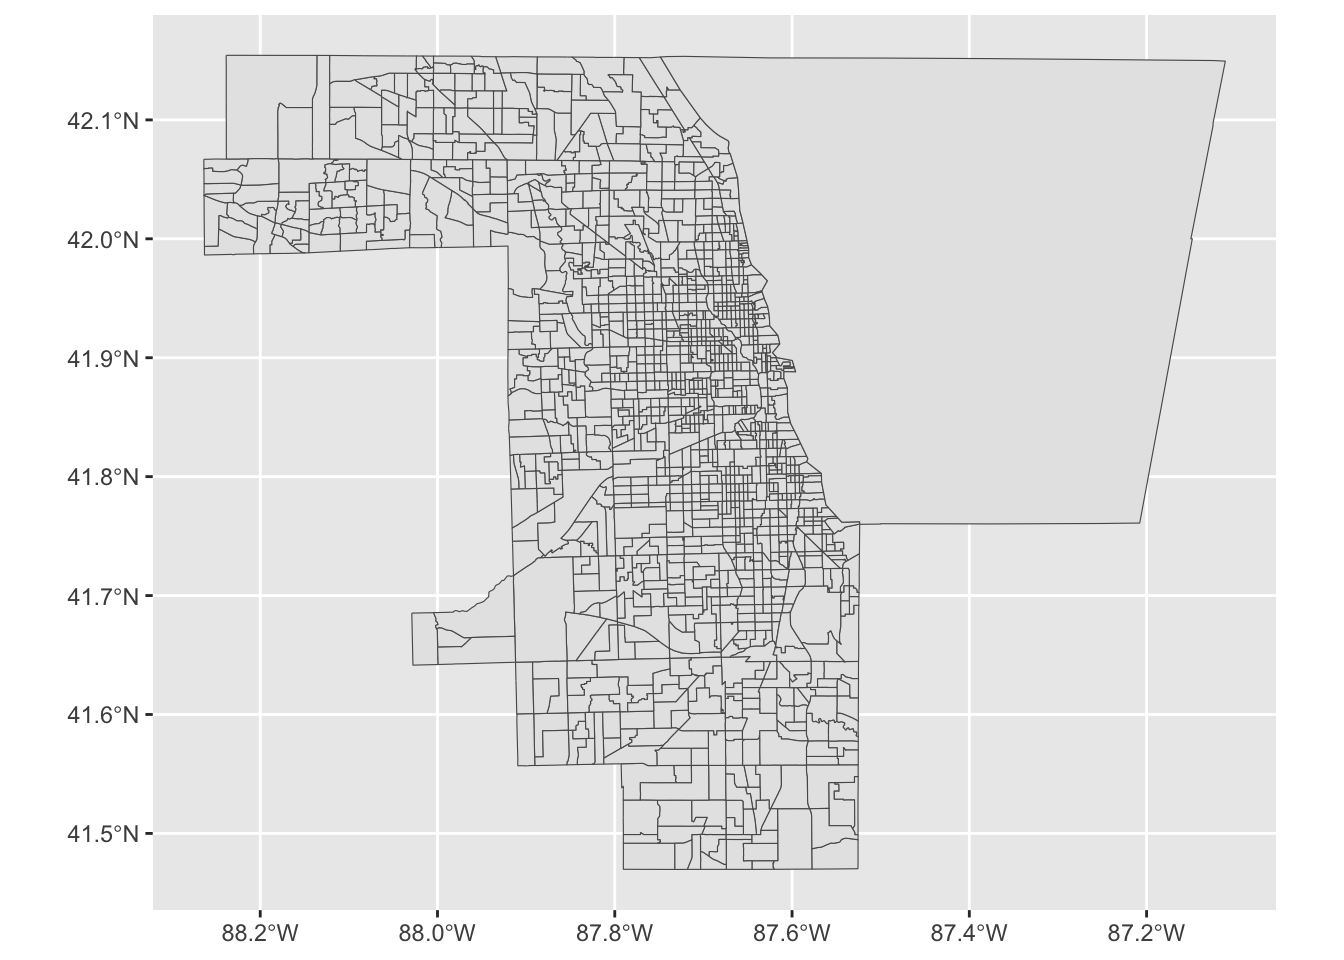
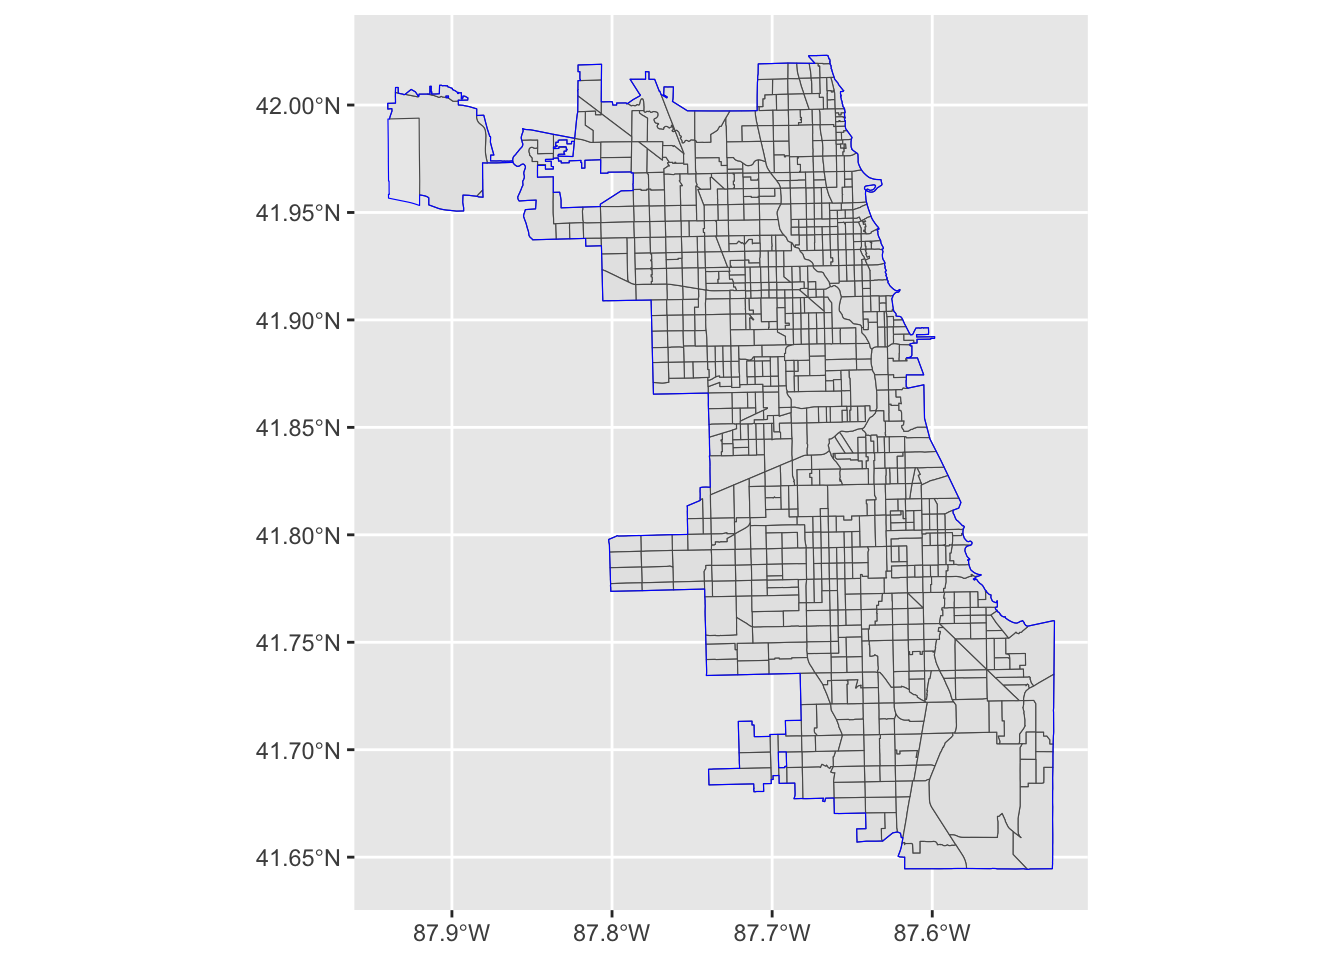
First, download tracts, subset to Cook County, and plot to confirm:
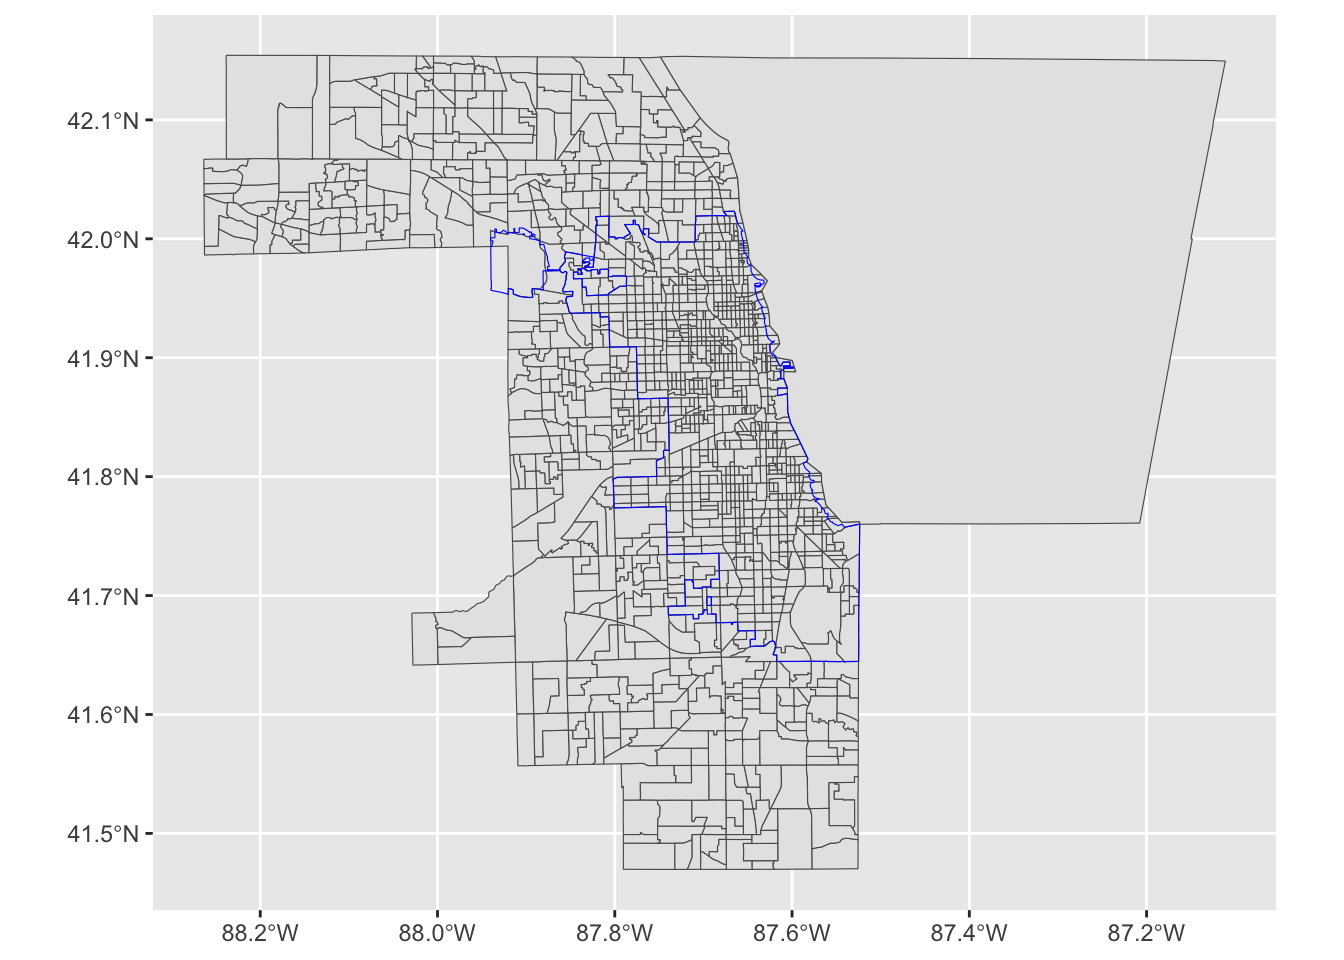
ggplot()+geom_sf(data = il_trt, cex=.1)+geom_sf(data = il_place, color ="blue",cex = .5, fill =NA)
Option 1: Spatial Join
Perform a spatial join to identify all tracts that overlap with Chicago’s municipal boundaries, plot to confirm:
test <-st_join(il_trt, il_place) |>filter(NAME.y =="Chicago")ggplot() +geom_sf(data = test) +geom_sf(data = il_place, color ="blue", fill =NA)
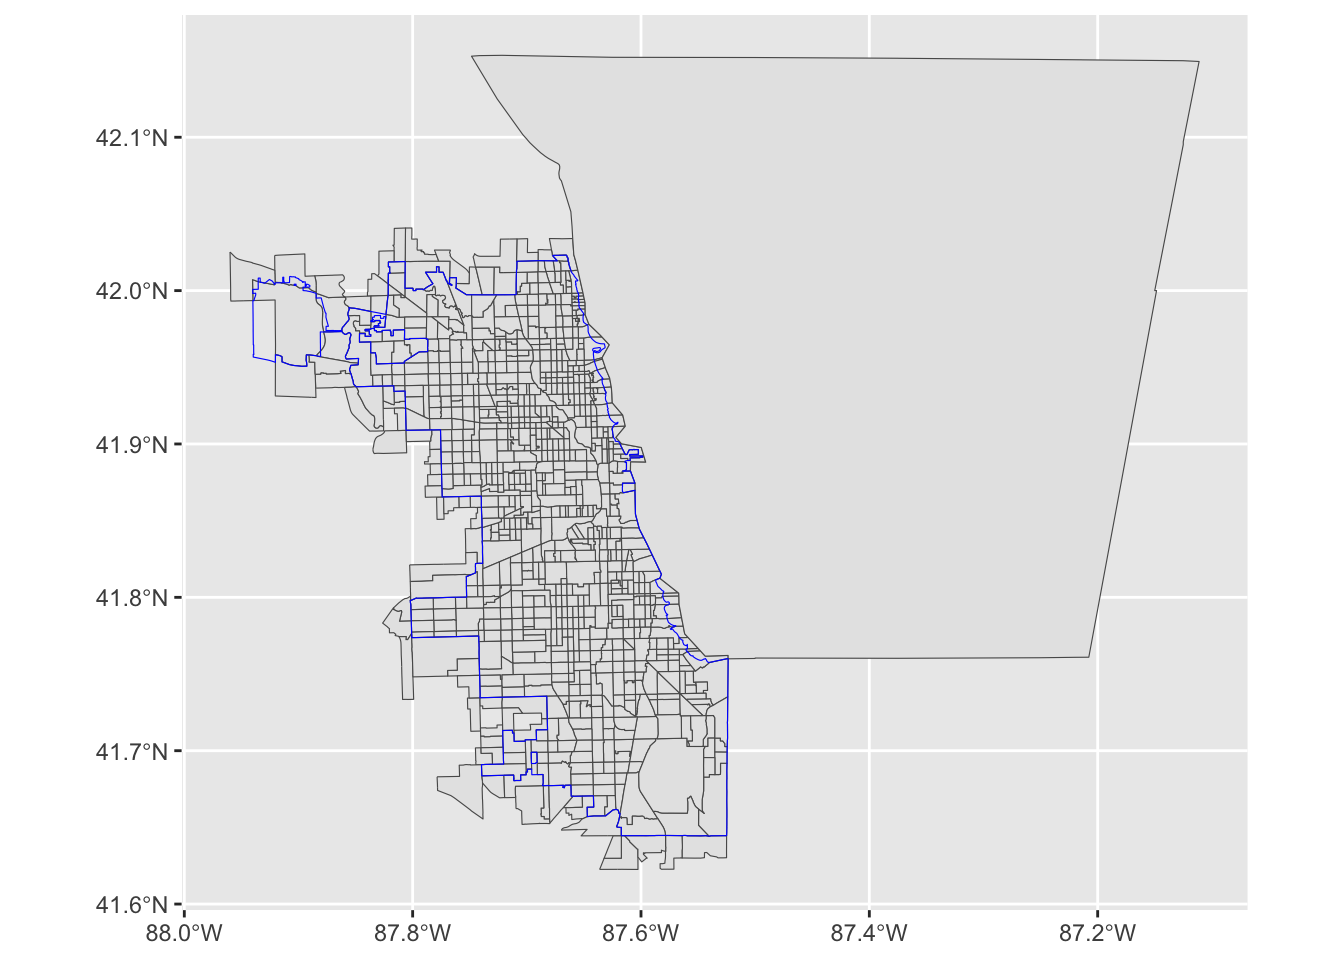
Option 2: Intersection
Another option is to find the spatial intersection of the two objects:
test2 <-st_intersection(il_trt, il_place)ggplot() +geom_sf(data = test2)+geom_sf(data = il_place, color ="blue", fill =NA)
As we discussed in class, there may be good reasons for pursuing either method. Intersection may produce visually “cleaner” output, but we may need to spend more time explaining that there are portions of tract geometry that fall outside of the city boundary. We may even want to do some analysis to estimate where uncertainty may come from due to our strategy.